Invest Like the Japanese in India

While markets often react to short-term narratives, some of the most enduring wealth has been created by investors who think in decades, not quarters. Japanese and Korean capital in India offers a powerful case study of this long-term mindset. Across automobiles, financial services, energy, electronics, and manufacturing, they have invested in 2,000+ Indian companies, consistently backing scale, governance, and execution rather than short-term cycles.

From Suzuki’s journey with Maruti, to Hitachi’s transformation of ABB’s power grid business, to Nippon Life’s revival of Reliance Mutual Fund, these investments reveal a clear pattern:


Long-term capital + operational discipline + local execution = sustained wealth creation.


As global patient capital commits to India’s multi-decade growth story, we believe investors should align with this same long-term conviction.

  1. Maruti Suzuki: 120X in 23 years

    Maruti Suzuki is India’s largest carmaker, selling more cars annually than several global markets combined. With deep localization, the country’s widest sales and service network, and strategic backing from Suzuki Motor Corporation, the company has remained the market leader for over 40 years. It is India’s Largest Exporter of Passenger Vehicles with a Share of Nearly 43%.


    Initially, Maruti was majority-owned by the Indian government, with Suzuki only taking a 26% stake during its establishment in 1982. The Indian government gradually reduced its stake, partially departed the business in 2003 by making it a public company and then sold all of its remaining shares to Suzuki Motor Corporation in 2007.

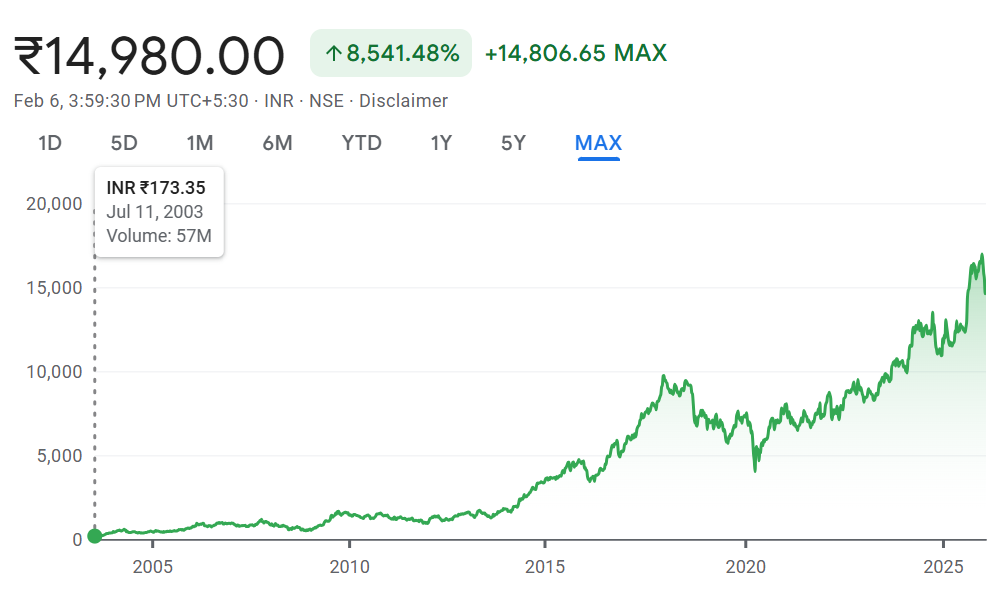
  1. Hitachi Energy’s Acquisition of ABB: 1500X in 6 years

    Hitachi is a global Japanese conglomerate focused on technology, industrial systems, and infrastructure solutions, including energy, mobility, and digital technologies.

    In July 2020, Hitachi Ltd. acquired an 80.1 % stake in ABB’s Power Grids business, creating a global energy technology leader with about $10 billion in annual revenue and a presence in 90+ countries. The business was renamed  Hitachi Energy as part of the Japanese group’s strategic expansion into power transmission and digital grid solutions.
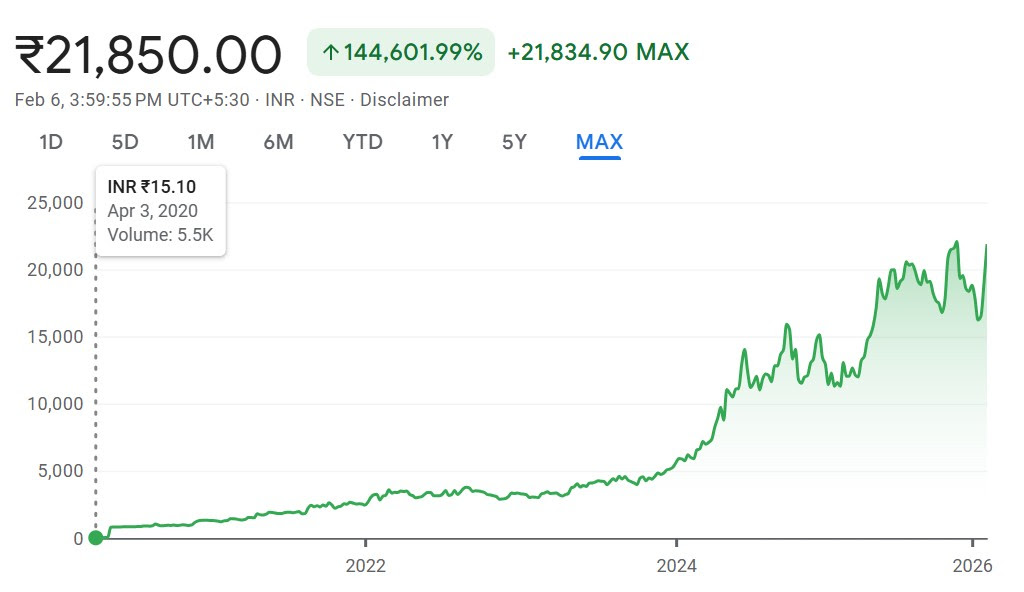
  1. Lumax Industries


    Lumax Industries is one of India’s leading automotive lighting and components manufacturers, supplying to major OEMs across passenger vehicles, two-wheelers, and commercial vehicles.

    Lumax Industries has compounded steadily on the back of its long-standing technical partnership with Japan’s Stanley Electric, which holds a strategic stake and provides access to advanced automotive lighting technology. Since its listing, Lumax’s stock has risen from ~₹31 (1999) to ~₹4,700+, translating into over 150× wealth creation, driven by consistent capacity expansion, strong OEM relationships, and disciplined manufacturing aligned with Japanese quality standards.

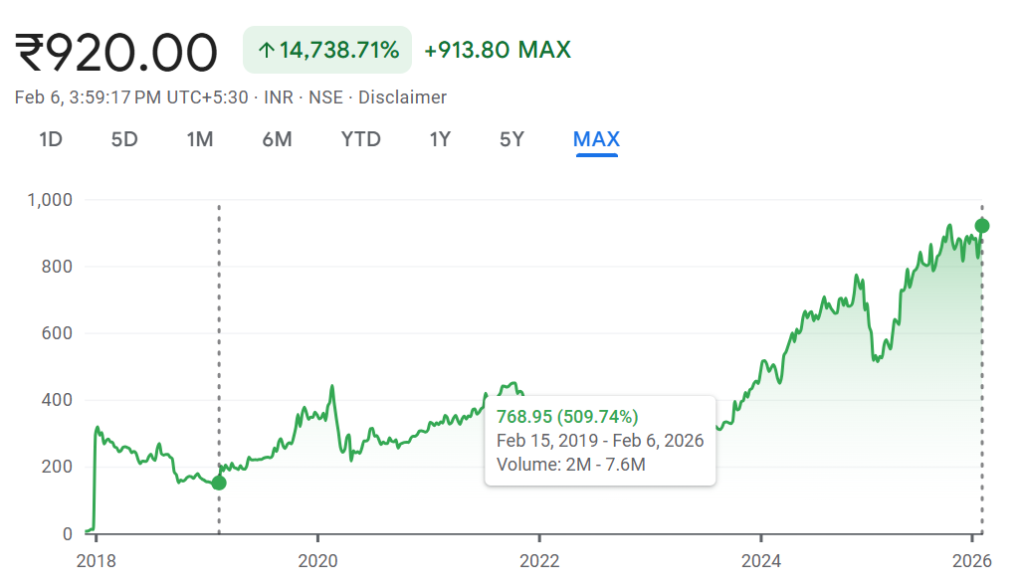
  1. Nippon’s Reliance MF Journey: 5X in 6 years


    Prior to the 2019 Nippon takeover, Reliance Mutual Fund saw its overall market share fall from about 12% to around 8.5%  over a four‑year period. In 2019, Nippon Life Insurance of Japan acquired a majority stake (75%) in Reliance Mutual Fund, leading to its rebranding as Nippon India Mutual Fund. This marked the transition from being  part of the Reliance group to being majority‑owned by one of Japan’s largest  life insurers, bringing global expertise and stronger risk‑management  frameworks to the business.

Japan/Korean-linked corporates continue to deepen their India play. LG Electronics (listed recently) has significantly expanded manufacturing in India across consumer electronics and home appliances, tapping local demand and exports, while Hyundai Motor Company (recently listed), reflects strong localization and EV strategy. These developments highlight a broader shift toward technology transfer, scale creation, and long-term structural investments — reinforcing the theme of disciplined, patient capital in India.

Japanese/Korean Investments in India in 2025

  1. In 2025, Japan’s SMBC (Sumitomo Mitsui Banking Corporation) — part of the Sumitomo Mitsui Financial Group (SMFG) — agreed to buy a large stake (around 24.22%) in Yes Bank from existing Indian shareholders.

  2. In late 2025, Japan’s MUFG (Mitsubishi UFJ Financial Group) agreed to invest around ₹39,600+ crore to buy a 20% stake in Shriram Finance Ltd — one of India’s largest non-bank financial companies (NBFCs).


I believe Japan/Korea will increasingly view India as its next major growth market, and I am willing to bet on this trend due to the following structural factors:

  1. Japanese corporations are globally respected for their ethical governance, punctual execution, and long-term orientation, making them reliable partners and investors.

  2. Japan is a cash-rich economy facing structural stagnation due to an ageing and declining population. As the world’s fourth-largest economy, it urgently needs high-growth destinations to deploy capital.

  3. Under the Japan–US trade framework, Japan has committed to investing ~$500 billion in the US while sharing profits with US, making diversification imperative to avoid over-dependence on its largest market.

  4. China–Japan relations are at multi-decade lows, with Japan increasingly viewing China as a strategic threat. In contrast, Japan has significantly over-invested in India, deploying ¥247 billion more than its committed amount in FY2025, signalling strong long-term confidence in India as a strategic and economic partner.

As investors, the opportunity is not to predict the next quarter, but to align with businesses and themes that can compound over many years. When some of the world’s most disciplined investors are committing patient capital to India, it reinforces our belief that long-term ownership, not short-term timing, is the most reliable path to wealth creation. We remain focused on staying invested in quality, scale, and governance-led opportunities that can benefit from India’s multi-decade growth journey.

The Silent Takeover of Indian Hospitals

Foreign investors have withdrawn nearly ₹1.65 lakh crore from Indian equity markets in 2025.
Yet, amid this broad sell-off, one sector is attracting foreign capital like never before: Indian hospitals.


Today, nearly half of India’s leading hospital chains are owned or controlled by global private equity.


This shift did not happen overnight.

The Turning Point: 100% FDI in Healthcare


In 2015–16, India quietly opened the floodgates by allowing 100% Foreign Direct Investment (FDI) in healthcare—no caps, no prior government approval, full foreign ownership.


Since then, global capital has moved decisively into Indian healthcare:

  • Manipal Hospitals: 59% owned by Temasek

  • Care Hospitals: 73% owned by Blackstone

  • Medanta (Global Health): backed by CVC Capital

  • KIMS: ~80% owned by Blackstone

  • BMH: ~70% owned by KKR

  • Sahyadri Hospitals: 100% owned by Ontario Teachers’ Pension Plan

Why Global Capital Is So Bullish on Indian Healthcare


The reasons are structural and compelling:

  1. A $650 billion market — simply too large to ignore.

  2. Severe capacity shortage — just 0.6 hospital beds per 1,000 people, versus the recommended 3 beds.

  3. Rising affordability — driven by government schemes, corporate health cover, and individual insurance penetration.

  4. Exceptional wealth creation — hospital stocks have delivered stunning returns in just five years:

    • Fortis: ~400%

    • Max Healthcare: ~559%

    • Narayana Health: ~320%

    • Artemis Hospitals: ~1,085%

    • Apollo Hospitals: ~200%

  5. Demographics — over 19 crore Indians are above 60, sharply increasing demand for chronic and elderly care.

  6. Disease burden — 1 in 4 Indians suffers from some illness; India is already the diabetes capital of the world, and is rapidly moving toward being a major hub for hypertension and cancer cases.

  7. Medical tourism boom — India ranks among the top 5 global medical tourism destinations, attracting ~2 million international patients annually and generating an industry worth ~$13 billion.

  8. Government red carpet — full foreign ownership without prior approval has made India one of the easiest healthcare markets for global investors to enter.

The Other Side of the Story: Serious Concerns


However, this surge of private equity ownership is not without risks.

  • Profit vs. patient care: A recent study led by researchers at Harvard Medical School found that patients are more likely to suffer complications, infections, or adverse outcomes after hospitals are acquired by private equity firms.

  • Changing role of doctors: Doctors are increasingly treated as employees with revenue and margin targets, rather than autonomous professionals focused solely on patient outcomes.

  • Long-term risks: While foreign capital may drive short-term expansion and efficiency, it could come at the cost of quality, affordability, and equitable access over time.


Global capital may be voting with its money—but the real question is whether India’s healthcare system will ultimately serve patients first, or portfolios first.

Why the Dollar Remains King

~58% Global FX Reserve Share (USD)

~90% FX Trades Involve USD

~80% Global Oil Trade in USD

In an era of rising multipolarity, deglobalization pressures, and growing calls for de-dollarization, one question dominates macro discussions: can anything dethrone the U.S. dollar? In this edition, we lay out the structural, financial, and geopolitical architecture that keeps the greenback at the apex of the global monetary system — and what risks, if any, could alter this hierarchy.

01 — Reserve Currency Status


The Dollar’s Iron Grip on Global Reserves: The USD has served as the world’s primary reserve currency since the Bretton Woods Agreement of 1944. Central banks globally hold dollars to settle international trade, service dollar-denominated debt, and manage currency volatility. Despite decades of speculation about its decline, the dollar’s reserve share has remained broadly stable.


The Euro is a distant second at roughly 20%, followed by the Japanese Yen (~6%) and Pound Sterling (~5%). The Chinese Yuan — despite significant geopolitical push — holds merely ~2.3%, constrained by capital controls and limited financial market depth.

02 — The Petrodollar System

Oil Priced in Dollars: The Indispensable Anchor: The petrodollar system — born from the U.S.–Saudi agreement in 1974 — created a self-reinforcing loop: oil is priced and settled in USD globally, meaning every nation that imports oil must hold dollars. This single mechanism ensures perpetual global demand for the greenback, regardless of U.S. trade deficits

While there are growing experiments with yuan, rupee, and dirham-denominated oil trades (particularly between Russia, China, India, and Gulf states), these represent a small fraction of total flows. OPEC+ nations still invoice the overwhelming majority of crude exports in USD, keeping the structural architecture intact

“The petrodollar is not merely a trade mechanism — it is a geopolitical instrument. As long as oil remains the world’s primary energy input and is priced in dollars, the United States benefits from an extraordinary structural privilege: the ability to run persistent deficits financed by the rest of the world’s need to hold its currency” — Macro Strategy Desk Analysis

03 — Money Supply & Fed Policy


Dollar Printing: Exorbitant Privilege or Ticking Clock?: The U.S. Federal Reserve has the unique ability to create dollar liquidity that the entire world absorbs. During COVID-19 (2020–2021), the Fed expanded its balance sheet from ~$4T to over $9T — a near-doubling — yet the dollar remained the world’s safe-haven. This reflects the “exorbitant privilege” coined by French economist Valéry Giscard d’Estaing: the U.S. can finance its deficits in its own currency without the currency crisis that would befall any other nation.


The M2 money supply in the U.S. grew from approximately $15 trillion in 2019 to over $21 trillion by 2022. Despite this aggressive expansion, global dollar demand — driven by trade, debt servicing, and reserve accumulation — absorbed the excess supply, limiting the inflationary global spillover onto dollar dominance itself.

04 — Dollar Trade Dominance


SWIFT, Trade Finance & the Network Effect: Beyond oil and reserves, the dollar dominates because of deeply embedded network effects. Approximately 40% of global trade invoicing occurs in USD — far exceeding the U.S.’s share of world trade (~12%). SWIFT, the global financial messaging system, routes the majority of international transactions through dollar-clearing correspondent banks in New York.


This creates a sticky, self-reinforcing ecosystem: businesses invoice in dollars because counterparties expect it; banks hold dollar liquidity because loans are dollar-denominated; and sovereign borrowers issue dollar bonds because global investors demand them. The transition cost of shifting this network is enormous.

05 — The Road Ahead


USD Outlook: Structural Resilience, Gradual Erosion: The USD share in global reserves has declined from ~71% in 2000 to ~58% today — a shift, not a collapse. The rise of BRICS payment mechanisms, yuan internationalisation, and gold accumulation by emerging market central banks represent diversification, not displacement.


The key risks to monitor are: a significant loss of U.S. institutional credibility (fiscal dysfunction, debt ceiling crises), a viable deep-liquidity alternative emerging (unlikely before 2035), or a commodity market structural shift away from oil (long-term energy transition scenario).


The dollar’s throne is not under immediate threat. Its dominance rests on three interlocking pillars — financial network effects, the petrodollar system, and U.S. capital market depth — none of which can be dismantled overnight.

March dip may be an opportunity

As we approach the final weeks of the financial year, we wanted to share an important market observation that has quietly played out for Indian equity investors over the past several years — something we call The April Theory.

What Is the April Theory?


Every year, as India’s financial year draws to a close on March 31st, equity markets tend to witness a phase of selling pressure — often stretching from late February through mid-April. While this can feel unsettling in the moment, history suggests that this weakness is often temporary, and that April frequently marks the turning point for a fresh market upswing.


★  Key   Insight: The April–June quarter has delivered positive returns in 8 out of the last 10 years for the Nifty 50   — making it one of the strongest seasonal windows in Indian equity markets.


The Data Speaks for Itself: Nifty 500 — Last 5 Years

Why Does This Happen? The Tax-Loss Harvesting Effect


The selling pressure into March is not random — it is driven by a well-known but often underappreciated behaviour: Tax-Loss Harvesting.


Indian investors must close their books by March 31st each year. Those who have made gains are liable to pay capital gains tax. To reduce this burden legally, many investors:


1. Identify loss-making holdings in their portfolio

2. Sell them before March 31st to “book” the losses officially

3. Offset these losses against their gains, reducing net taxable capital gains

4. Re-enter the market in April — redeploying capital at the start of the new financial year


Illustrative Example

An investor has ₹7 lakh in capital gains and also holds stocks with ₹3 lakh in unrealised losses.

By selling those loss-making stocks before March 31st, they reduce their taxable gains to just ₹4 lakh — saving significantly at both STCG (20%) and LTCG (12.5%) rates.

After April 1st, these investors return to the market  — fuelling the seasonal recovery.

What Does This Mean for investors?

This seasonal pattern does not guarantee future performance, and markets can always surprise. However, the consistent presence of this dynamic suggests:

  • Market weakness in February–March should not be mistaken for a structural breakdown. Much of it is FY-end noise.

  • April often presents an attractive entry point — historically, investors who added to their portfolios during the March–April dip benefitted from the subsequent new-FY rebound.


Being patient through year-end volatility has historically been rewarded. Discipline at this juncture separates  long-term wealth creators from reactive investors.